PERFORMANCE
GROSS WRITTEN PREMIUM
2024
Rs. 37 Bn
2023
Rs. 33 Bn
▲ 12% Increase
INVESTMENT AND
OTHER INCOME
2024
Rs. 28.4 Bn
2023
Rs. 28 Bn

INSURANCE a PROVISION - LONG-TERM
2024
Rs. 181 Bn
2023
Rs. 157.5 Bn
NET CLAIMS AND BENEFITS
2024
Rs. 25 Bn
2023
Rs. 23 Bn
▲ 9% Increase

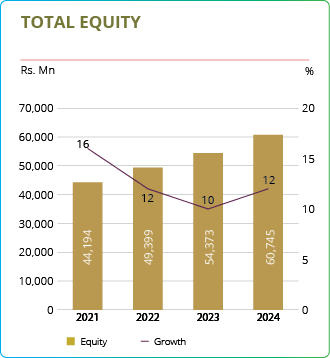
TOTAL EQUITY
2024
Rs. 61 Bn
2023
Rs. 54.4 Bn
▲ 12% Increase

PROFIT BEFORE TAX
2024
Rs. 10 Bn
2023
Rs. 8.4 Bn
▲ 9% Increase

INVESTMENTS IN FINANCIAL INSTRUMENTS
2024
Rs. 214 Bn
2023
Rs. 189.3 Bn
▲ 13% Increase
GROSS CHANGE IN CONTRACT LIABILITIES
2024
Rs. 23 Bn
2023
Rs. 23 Bn
PROFIT AFTER TAX
2024
Rs. 7 Bn
2023
Rs. 5.8 Bn
▲ 17% Increase
TOTAL ASSETS
2024
Rs. 251.4 Bn
2023
Rs. 224.7 Bn
▲ 12% Increase

FINANCIAL PERFORMANCE
At Ceylinco Life, maintaining strong financial results, steady returns, and robust controls are key to enhancing shareholder value and ensuring long-term organisational success. Our financial performance and stability lie at the heart of achieving exceptional levels of stakeholder loyalty and trust reinforced by our unique value proposition, far-reaching presence, and leadership in the market.
UNDERSTANDING CLI’S APPROACH TO
FINANCIAL PERFORMANCE
Key Challenges:
The decline in discretionary spending and a low interest rate environment posed negative impacts to financial performance across businesses, further underscored by growing operational expenses due to the inflationary environment that prevailed during the year. The implementation of new regulations and standards remained a key focus area during the year, requiring significant revisions to internal processes and systems.
FINANCIAL PERFORMANCE
STRATEGIC INSIGHTS: A SWOT PERSPECTIVE
-
Market leadership in the life insurance business continuously 21 years, demonstrating strong brand trust.
Strong financial performance, consistently reporting high premium income, profitability, and stable solvency margins.
A robust investment portfolio comprising diversified investments in government securities, real estate, and other stable assets.
A customer-centric approach, with a focus on policyholder benefits, claims settlement efficiency, and innovative solutions.
STRENGTHS
-
The conservative investment strategy may sometimes lead to lower investment yields, but at reduced risk.
Maintaining an extensive branch network and underwriting risk management processes contributes to higher operational expenses.
The company’s product portfolio still relies heavily on traditional life insurance policies, necessitating greater innovation in AI-driven and green insurance solutions.
WEAKNESSES
-
Sri Lanka’s life insurance penetration remains low, providing room for expansion.
Implementing AI-driven need analysis tools, chatbots, and digital underwriting can improve efficiency.
Expanding ESG-integrated insurance solutions and aligning with UN Global Compact principles.
Increasing demand for retirement planning and health insurance presents new market opportunities.
OPPORTUNITIES
-
Macroeconomic instability, including currency depreciation and inflation, may impact customers’ ability to afford life insurance policies, affecting premium income.
Regulatory and tax risks may increase costs.
The growing frequency of climate-related disasters could lead to higher insurance claims, affecting profitability and reinsurance costs.
THREATS

hear from our leadership

P. A. JAYAWARDENA,
Senior Executive Director/ Chief Financial Officer
-
We were largely exposed to interest rate risks during the year. Proactive steps were taken to negotiate with banks and sign forward contracts, while the Company engaged in internal projections, forecasting and regular reviews to anticipate and mitigate any potential negative outcomes. Additionally, we relied on partnerships with research agencies and external consultants to obtain the necessary expertise and guidance to navigate the challenging macroeconomic climate.
In response to risks associated with the credit impairment of financial institutions, under the supervision of the operations investment committee, the Company ensured all investments were aligned with the minimum investment grade, and ensured compliance with the internal investment guidelines was maintained. Tax planning was undertaken with the assistance of a tax consultant and professional institutions.
Owing to the high inflationary environment, we engaged in cost rationalisation initiatives and budget planning and monitoring, while relying on digitalisation and integration of sustainable practices to drive resource efficiency.
We also engaged in the implementation of the latest financial, accounting, and sustainability standards during the year in consultation with experts from Sri Lanka and overseas, thereby upholding best practices. -
The past year was a period of resilience and strategic growth for the Company. Despite economic volatility and evolving regulatory landscapes, we maintained our market leadership, strengthened our investment portfolio, and enhanced our financial position. Our disciplined financial management, robust risk mitigation strategies, and commitment to sustainable growth have positioned us for long-term success.
-
We manage funds through a disciplined investment strategy that balances stability, liquidity, and profitability while ensuring policyholder obligations are met. Yield on invested assets was reported at 13% during the year.
The Company’s strategy with respect to fund management is outlined below: -
As part of our commitment to sustainable f inance and climate resilience, we strategically invested in green bonds dedicated to solar energy projects. This investment aligns with our long-term ESG objectives, ensuring financial growth while contributing to a low-carbon future.
Green Bonds are any type of bond instrument where the proceeds will be exclusively applied to finance or re f inance projects with clear environmental benefits. Ceylinco Life invested Rs. 2 Bn in Sri Lanka’s first Green Bond issued by DFCC bank (the first ever Green Bond issuance in Sri Lanka) which is to be listed in the Colombo Stock Exchange that benefits the nation’s solar sector. The Company served as an anchor investor in this bond, in an emphatic demonstration of the Company’s commitment to sustainability.
The Company’s strategy with respect to fund management is outlined below:
| Asset Liability Management | Matching assets to liabilities, minimising interest rate and reinvestment risks | Refer to the ALM Framework on page 376 |
| Diversified Investments | Allocate funds across fixed income (bonds), equities, real estate, and short-term liquid assets to optimise returns and manage risk | Refer to Financial Instruments note on page 319-334 |
| Risk & Liquidity Management | Maintaining liquidity
buffers, and conducting stress
testing to ensure financial strength. Long-term liabilities (e.g., annuities, whole life policies) are matched with long-term investments to prevent reinvestment risks. |
Refer to Risks and Opportunities on page 76-89 |
| Regulatory Compliance | Adhering to solvency, RBC, and SLFRS 4 requirements, ensuring transparency and policyholder protection. | Refer to ratios outlined on page 376 |
| Balanced Maturity Profile | Ensuring insurers meet obligations without having to liquidate assets at unfavourable prices. | Refer to Maturity Profile on pages 387-390 |
Retaining Market Leadership
Our dedication to building resilience and enhancing value for policyholders has been key to maintaining market leadership. By overcoming challenges and constantly improving, we build trust and loyalty with customers, securing our position as a market leader for long-term success.
| Industry | Ceylinco Life | Our Contribution % | |
|---|---|---|---|
| GWP (Rs. Bn) | 184.00 | 37.14 | 20.2% |
| GWP Growth Rate ( yoy%) | 20% | 11% | |
| Benefits Paid (Rs. Bn) | 84.00 | 25.30 | 30.1% |
| Benefits Paid Growth (yoy%) | 10% | 8% | |
| Investment Income (Rs. Bn) | 101.00 | 27.74 | 27.5% |
| Investment Income Growth (yoy%) | 5% | 1% | |
| Profits Before Tax (Rs. Bn) | 33.00 | 10.05 | 30.5% |
| Profits Growth Rate (yoy%) | 8% | 19% | |
| Total Assets (Rs. Bn) | 924.00 | 251.44 | 27.2% |
| Total Assets Growth Rate (yoy%) | 13% | 11.9% | |
| Capital Adequacy Ratio (%) | 338% | 448% |
Maintaining Consistent Returns
"Ceylinco Life maintained its market leadership in the life insurance industry for the 21st consecutive year, thereby contributing towards improved returns"

ratio analysis
Revenue Ratios
Solvency Ratios
Investor Ratios
Profitability Ratios
Efficiency Ratio
Insurance-specific Ratios
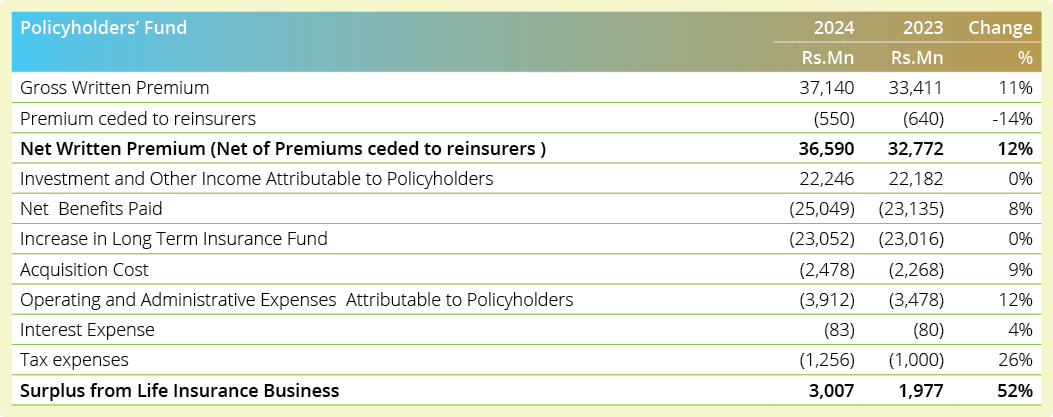
policyholders’ fund
The following table represents the summary of transactions resulted in changing the policyholders’ fund as at the year ended 31st December 2024.
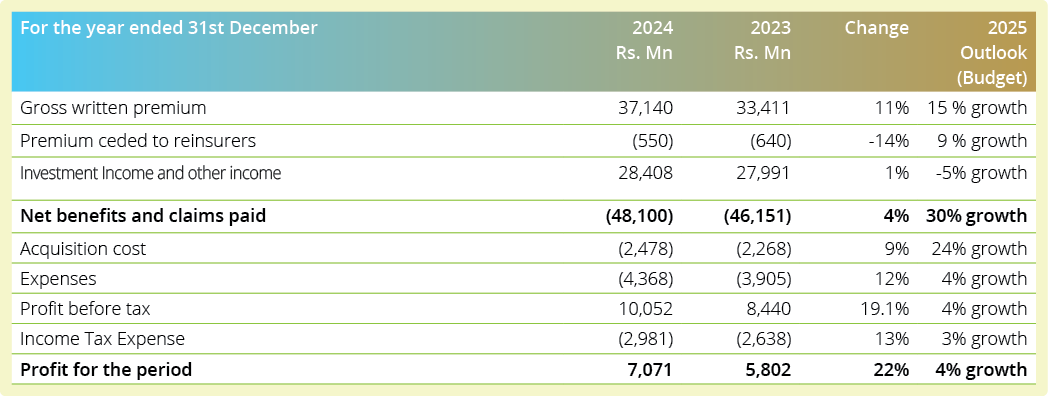
income statement
The following table represents the performance of material line items of the income statement between the year under review and the preceding year. This includes financial performance with respect to gross written premium, investments and other income generated, and costs incurred, along with profits generated during year. The table also outlines future prospects of the organisation and the potential to deliver returns.
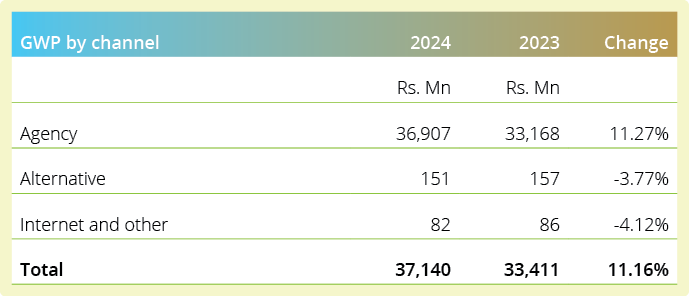
gross written premium
Gross Written Premium serves as the primary source of income of the Company, and is derived before deducting reinsurance and ceding commission. During the year the Company achieved a 11% increase against the previous year to reach Rs. 37,140 Mn, compared to Rs. 33,411 Mn recorded in 2023. The main contributor to this growth is renewal premium income.
GWP nature-wise
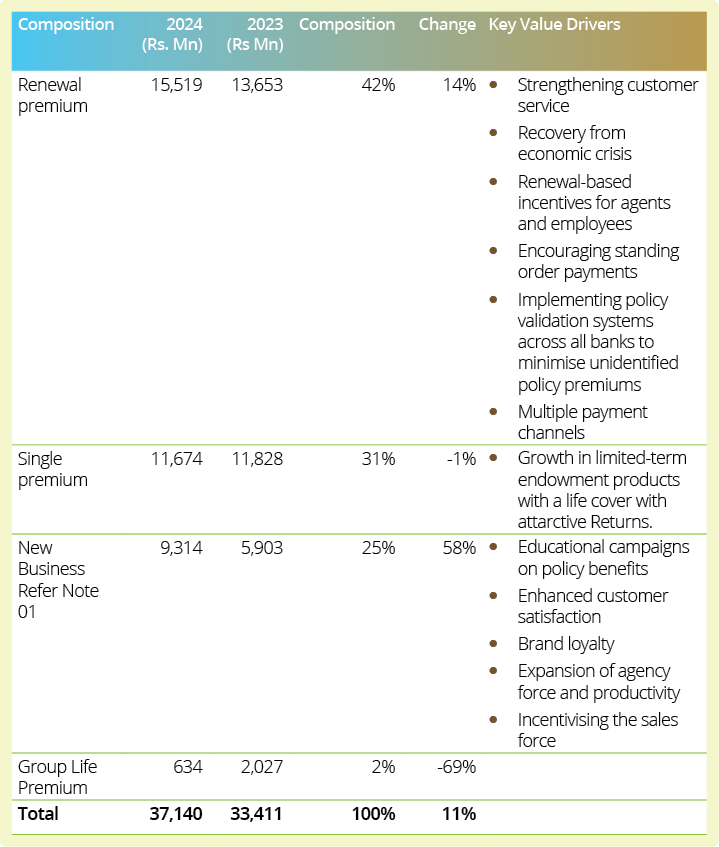
Note 01
GWP channel-wise
Ceylinco Life primarily operates via three channels, namely Agency (individual sales agents), Alternative Channels (Bancassurance, brokers and corporates) and Internet and Online, which includes social media. 99.37% of total premium is collected through the agency channels which reflects a 11.27% growth compared to 2023.
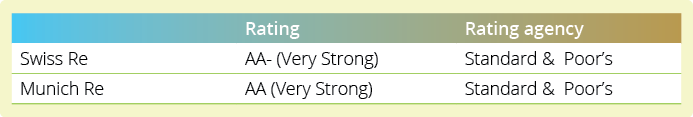
premium ceded to reinsurers
The Company diversified and partnered with two leading reinsurance companies namely, Swiss Re and Munich Re. The premium ceded declined by 14% YoY to reach Rs. 550 Mn. Their respective ratings are listed below.
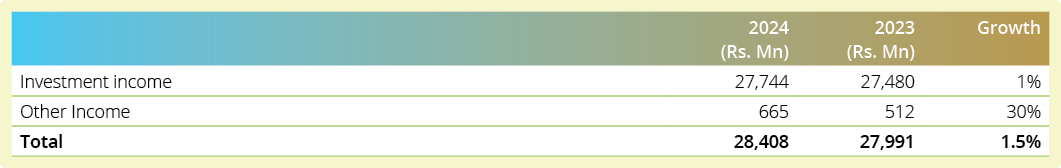
investments and other income
Investment income for the year remained stable, despite a sharp decline in market interest rates during the year, evidencing the prowess of our conservative investment strategy. Notably, our investment income reached an all-time high, surpassing LKR 28,408 Mn, outstripping the previous year’s high of LKR 27,991 Mn, showcasing the fruits of our resilient investment strategy in navigating challenging economic conditions.
Key Points
- Despite a sharp decline in market interest rates during the year, investment income grew by 1.5% year-on-year, reaching an all-time high of LKR 28,408 Mn.
- The growth surpasses the previous year's high of LKR 27,991 Mn, driven by robust returns from the fund’s diversified portfolio.
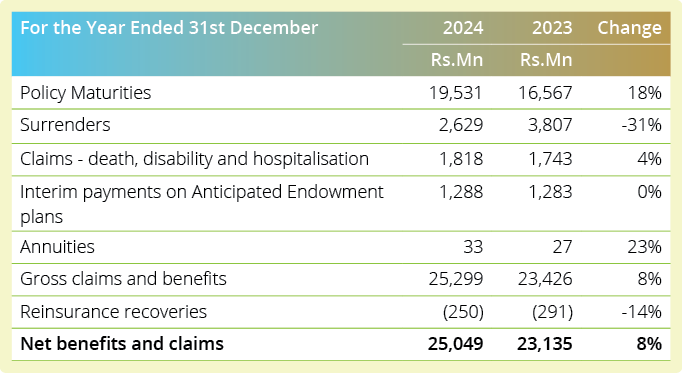
net benefits and claims paid
The increase in net claims was driven by policy maturities during the period. The Company is a well-established matured Company, resulting in high policy maturities. Policy surrenders dropped due to several reasons such as favourable economic conditions, improved customer retention strategies, higher policyholder awareness and education, product design and flexibility. The Company's incurred claims ratio stood at 68%, well within the industry benchmark of 50%-100%. This is a further indication of the Company’s smooth and efficient management of the claim settlement process.
gross change in contract liabilities
During 2024, the Company transferred a significant amount of Rs. 23,052 Mn to the Long Term Insurance Fund following a transfer of Rs. 3,007 Mn to the Shareholder's Fund (2023: Rs. 1,977 Mn). This reflects an increase of 52% from the preceding year. This transfer was made possible by the GWP growth and the stable investment income. These were sufficient to absorb the escalation in acquisition costs customer benefits paid.
expenses
Expenses are categorised into two segments, namely, other operating and administration expenses and finance costs.
acquisition cost
Acquisition cost increased from the previous year by 9.3% to reach Rs. 2,478 Mn (2023: Rs. 2,268 Mn), corresponding to the 11% GWP increase that took place during the year. Acquisition costs mainly comprises the commission expenses paid to sales agents during the year.
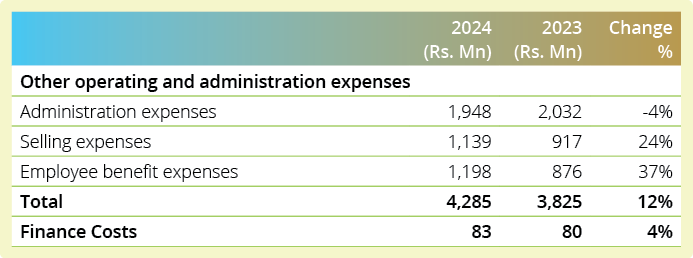
The total operating and administration expenses increased by 12% during the year mainly due to the increase in employee benefit expenses, which reached Rs. 1,198 Mn during the period. Rs. 129.3 Mn was allocated as a contribution distributed to employees in recognition of their years of dedicated service. Salary expenses increased by 9% YoY, while the medical fund contribution increased by 3% YoY. Investing in employee benefits fosters a motivated, engaged, and loyal workforce, driving long-term success and organisational growth. The Company’s contributions to the pension and gratuity funds were reversed by Rs. 1.7 Bn resulting from the fair values of the planned assets being higher than the plan liabilities.
Selling expenses increased by 24% during the year mainly due to the increase in rewards given to the sales staff and the increase in expenses on advertising and business promotion.
During the year, the Company was able to reduce administrative expenses by 4%. By implementing sustainable practices and investing in advanced software solutions to streamline administrative processes, Ceylinco Life was able to reduce costs, and enhance long-term efficiency and environmental responsibility.
The Company was able to save Rs. 149 Mn from software, maintenance, building, maintenance, vehicle and other maintenance expenses during the year, while the stationery cost reduced by 10% from Rs. 50.7 Mn in 2023 to Rs. 45.6 Mn in 2024. The Company achieved 18% saving on electricity YoY in absolute terms, amounting to Rs. 13 Mn due to its investment in solar panel systems. The professional and consultancy fees spent by the Company increased to 5% YoY from the previous year’s due to the SAP upgrade and other professional fees incurred for implementing SLFRS 17/ SLFRS 09.


EBITDA represents the cash profit generated by the Company's operations. During the year, the Company’s EBITDA improved to Rs. 10,627 Mn from Rs. 8,976 Mn whereas the EBITDA margin improved to 29% in 2024 from 27% recorded in 2023. During the year, an increase in EBITDA and EBITDA margin was recorded as a result of the growth in GWP, increase in the surplus transfer to shareholders. Additionally, the increase in net claims and benefits paid and other expenses exerted a downward pressure on EBITDA during the period.
profit before tax (PBT) and profit after tax (PAT)
Profit Before Tax (PBT) increased by 19% year-on-year to Rs 10,052 Mn, in comparison to Rs. 8,440 Mn recorded in 2023. Earnings Per Share (EPS) increased by 22% YoY to reach Rs. 141.43 per share compared to the earnings of Rs. 116.04 per share in 2023. The number of ordinary shares remained unchanged while EPS growth was driven by the rise in net profits during the period.


INCOME TAX
Income tax expense increased during the period by 13% to Rs. 2,980.5 Mn from Rs. 2,637.9 Mn in 2023. With the increase in the surplus transfer during the year, associated income tax expense also increased.
TOTAL COMPREHENSIVE INCOME
Total comprehensive income grew by 40% during year to Rs. 7,501 Mn (2023 - Rs. 5,076 Mn). This was mainly due to the higher profit after tax and other comprehensive income recorded during the year.
Prudent, Farsighted Investments
STATEMENT OF FINANCIAL POSITION
The statement of financial position of the Company lists the assets, liabilities, and equity of the organisation as at the reporting date. Material line items are discussed in detail below.
| As at 31st December | 2024 Rs. Mn | 2023 Rs Mn | Change |
|---|---|---|---|
| Total Assets | 251,437 | 224,746 | 12% |
| Property, Plant and Equipment and Intangible Assets | 13,914 | 13,080 | 6% |
| Investment Property | 4,755 | 4,647 | 2% |
| Investment In Subsidiaries | 1,511 | 1,511 | 0% |
| Investments in Associates | 2,642 | 2,642 | 0% |
| Financial investments | 213,601 | 189,301 | 13% |
| Employee Gratuity/ Pension Benefit Asset | 9,186 | 8,107 | 13% |
| Loans to Life Policyholders | 3,008 | 2,931 | 3% |
| Other Assets | 680 | 582 | 17% |
| Total Equity | 60,745 | 54,373 | 12% |
| Total Liabilities | 190,692 | 170,373 | 12% |
| Insurance Contract Liabilities - Life | 180,896 | 157,538 | 15% |
| Other Liabilities | 9,796 | 12,835 | -24% |
| Total Equity and Liabilities | 251,437 | 224,746 | 12% |
TOTAL ASSETS
The Company’s assets and investments are fundamental to long-term continuity, and serve to enhance organisational strength and stability in an increasingly volatile environment.
Our total asset base amounted to Rs. 251,437 Mn as at the year ended 31st December 2024, indicating an increase of 12% from Rs. 224,746 Mn in 2023. This increase could be mainly attributed to the growth in investments in financial assets, increase in the net book value of property, plant and equipment, intangible assets and investment properties, increase in loans to policyholders and increase in the Employee Gratuity/Pension Benefit Assets. Investments in subsidiaries and associates remained unchanged as no new share acquisitions took place during the year.
PROPERTY, PLANT AND EQUIPMENT AND INTANGIBLE ASSETS
| 2024 Rs. Mn | 2023 Rs Mn | Change | |
|---|---|---|---|
| Property, Plant and Equipment | 13,721 | 12,820 | 7% |
| Intangible Assets | 193 | 260 | -26% |
| Total | 13,914 | 13,080 | 6% |
Property, plant and equipment (PPE) increased by 5% year-on-year Accordingly, PPE accounted for 6% of the total assets at the close of the year. Freehold land and buildings are considered to be an admissible asset in capital adequacy calculations, and account for more than 90% of the value of property, plant and equipment (2023"-<"90%). During the year, the new PPE additions accounted for Rs. 614 Mn. The year also saw the company recognise a gain of Rs 573 Mn on revaluation of land and buildings held under property, plant and equipment (2023 - Rs 836 Mn).Intangible assets comprise of computer software of the Company. The decline in the carrying amount is due to the amortisation and write-off of such assets. During the year, the Company invested in the installation of new computer software valued at Rs. 84 Mn.
INVESTMENT PROPERTIES
The carrying value of investment properties has increased by 2% during the year. The Company added Rs. 17 Mn of new assets to the network and recognised a fair valuation gain of Rs. 91 Mn during the year.
INVESTMENT IN SUBSIDIARIES AND ASSOCIATES
The investments in subsidiaries and associates remained unchanged from the last year.
FINANCIAL INVESTMENTS
In compliance with the Sri Lanka Accounting Standards (SLFRS/LKAS) the Company categorises financial instruments as follows:
| Held To Maturity (HTM) | Loans & Receivables (L&R) | Available for Sale (AFS) | Fair Value through Profit or Loss (FVtPL) |
|---|---|---|---|
| Treasury Bill & Bonds | Staff Vehicle Hire | Treasury Bills & Bonds | Treasury Bills & Bonds |
| Debentures - Quoted | Staff Loans other than vehicle Hire Purchase | Quoted Share Investment | Short Term Investment - Quoted |
| Repo Investment | Unquoted Share Investment | ||
| Debentures - Unquoted | Debentures - Quoted | ||
| Debentures - Quoted | |||
| Term Deposits |
As Ceylinco Life is a life insurance company, with the exemption granted under SLFRS 17: Insurance Contracts, the Company has deferred the adoption of the latest standard SLFRS 9, until the effective date of SLFRS 17 which is on 1 January 2026.
| 2024 Rs. Mn | 2023 Rs Mn | Growth | Composition | |
|---|---|---|---|---|
| HTM | 119,151 | 111,170 | 7% | 56% |
| L&R | 93,648 | 69,590 | 35% | 44% |
| AFS | 9799 | 4,210 | -81% | 0% |
| FVTPL | 2 | 4,331 | -100% | 0% |
| Total | 213,601 | 189,301 | 12.8% | 100.0% |
Ceylinco Life’s investments in financial instruments are aligned with both regulatory requirements and internal investment guidelines. The Company’s strategy focuses on generating steady returns from a very higher quality portfolio of assets, ensuring longterm stability and growth. As of 31st December 2024, Government Securities accounted for 56% of Ceylinco Life’s total investments in financial instruments, compared to 63% in 2023. This drop was primarily due to the organisation’s preemptive strategy of reallocating Government Securities into fixed deposits issued by Licensed Commercial Banks with strong credit quality.
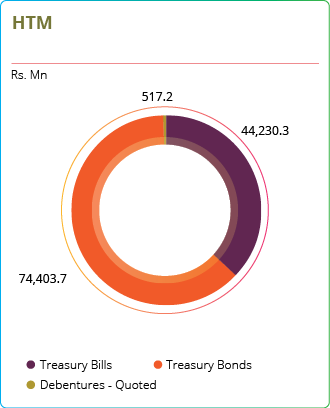
HELD-TO-MATURITY FINANCIAL INSTRUMENTS
Ceylinco Life maintains 56% of its financial instruments in Held-toMaturity (HTM) assets, As a prudent life insurer, the Company aligns its long-term investments with long-term insurance liabilities. Accordingly, 62% of the organisation’s HTM financial assets are allocated to government-backed Treasury Bonds, while the remainder is invested in Treasury Bills and quoted corporate debentures.
The Company primarily invests in corporate debentures from issuers with credit ratings ranging from AAA to A-, ensuring a balance between risk and return. This strategy aims to generate stable, predictable returns through low-risk investments while adhering to stringent regulatory and internal investment guidelines.
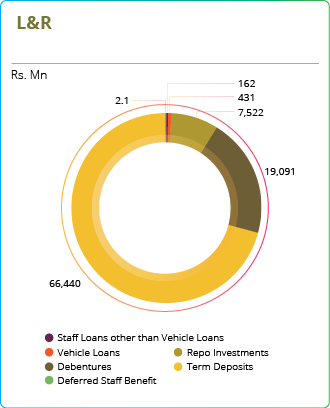
LOANS AND RECEIVABLES
Ceylinco Life holds 44% of its financial instruments in this category. Within the L&R portfolio, 71% consists of term deposits, primarily placed with licensed commercial banks, while the remainder is held with licensed finance companies. Additionally, 20% of the total portfolio is invested in convertible and non convertible debentures.
As a key milestone in sustainable investing, Ceylinco Life served as the anchor investor in Sri Lanka’s first-ever green bond, investing Rs. 2 billion in DFCC Bank’s issuance. This bond was launched to raise funds for projects that combat climate change and promote environmental sustainability.
Investing in Green Bonds for Solar Energy Projects
The DFCC Green Bond, which raised Rs. 2.5 Bn is Sri Lanka's first capital market debt instrument dedicated to renewable energy. Its primary focus is to fund solar energy projects in support of Sri Lanka’s goal of achieving 70% electricity generation from renewable energy by 2030.
Indirect Contribution to a Sustainable Investment Strategy as a Green Bond Investor
Investing in green bonds, particularly those financing solar energy projects, plays a crucial role in promoting sustainable investment strategies. As an investor, Ceylinco Life contributes indirectly in several key ways, as outlined below.
Capital Mobilization for Climate Action
- Providing long-term funding for renewable energy projects, helping transition away from fossil fuels.
- Accelerating the deployment of solar power infrastructure, reducing carbon emissions and promoting energy sustainability.
Strengthening ESG & Responsible Investment Practices
- Aligning the investment portfolio with ESG principles, ensuring that capital supports projects with measurable environmental benefits.
Supporting Financial Market Transformation
- Signals demand for sustainable finance, encouraging more issuers to enter the green bond market.
- Helps develop climate-focused financial instruments, making sustainable investment more mainstream.
Risk Mitigation & Long-Term Financial Stability
- Green bonds are often issued by strong institutions and backed by rigorous environmental standards, reducing credit and regulatory risks.
- As the world moves toward carbon neutrality, investing in sustainable projects lowers exposure to stranded assets in high-emission industries.
Promoting Renewable Energy & Energy Security
- Supports the expansion of decentralised solar energy systems, reducing dependence on fossil fuels and increasing energy resilience.
- This is especially critical in regions vulnerable to energy supply disruptions due to climate change.
Encouraging Transparency & Impact Reporting
- Green bonds require issuers to disclose how proceeds are used, ensuring accountability and measurable impact reporting.
- Contributes to strengthening governance and best practices in sustainable finance.
By investing in green bonds, the Company indirectly drives climate-positive finance, enhance market confidence in sustainable investments, and reduce longterm environmental and financial risks. This supports Ceylinco Life’s commitment to a resilient, low-carbon, and responsible investment strategy.
Indirect contribution towards SDGs:
| Eligible Projects / Criteria | Intended Environmental Benefit | Contributions to UN SDGs |
|---|---|---|
| Ground and rooftop mounted Solar PV electricity generation projects conforming to the requirements of the Sri Lanka Green Finance Taxonomy (May 2022) including mounting structures, transmission infrastructure, grid connections and other supporting infrastructure including inverters, transformers, energy storage systems and control systems. | Climate Change Mitigation through avoidance of Greenhouse Gas emissions |

|
| Source: Green Bond Framework August 2024 (DFCC Bank PLC) |
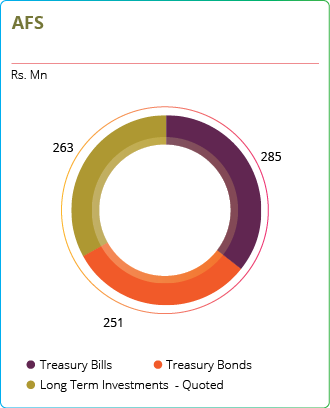
AVAILABLE-FOR-SALE FINANCIAL INSTRUMENTS
Available for sale (AFS) financial assets are financial assets designated as available for sale and are not classified in any of the other categories. 36 % of the AFS financial assets are held in Treasury Bills and 31% in Treasury Bonds and the remainder is invested in quoted and unquoted share investments.
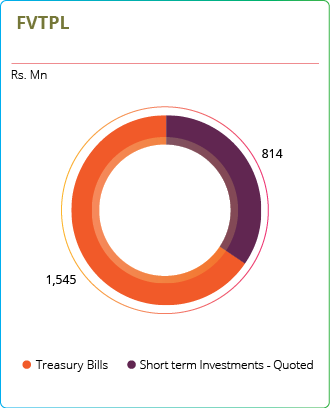
FAIR VALUE THROUGH PROFIT OR LOSS (FVTPL) FINANCIAL ASSETS
FVtPL assets are actively managed to capitalise on short-term market opportunities. As of December 31, 2024, the Company's Treasury Bill investments matured, and the proceeds were reinvested in other financial instruments. By year-end, the remaining funds were allocated to quoted equity investments.
EMPLOYEE GRATUITY AND PENSION BENEFIT ASSET
The employee gratuity and pension benefit asset grew 13% year-on-year and stood at Rs. 9,186 Mn. This increase is due to fair values of the plan assets being higher than the plan liabilities.
LOANS TO LIFE POLICYHOLDERS
Policyholder loans are granted up to 90% of the surrender value of a Life Insurance Policy at an interest rate equivalent to market rate. As at 31st December 2024, the loans granted increased by 3% from the previous year. The Company offered competitive interest rate to policyholders during the year and the rates are revised on a quarterly basis to maintain adequate adjustment to accommodate movements in market rates.
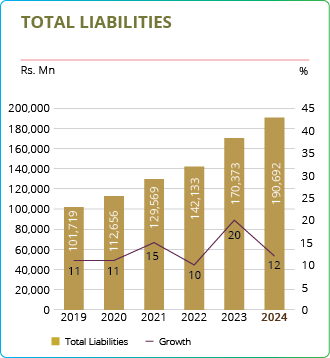
TOTAL LIABILITIES
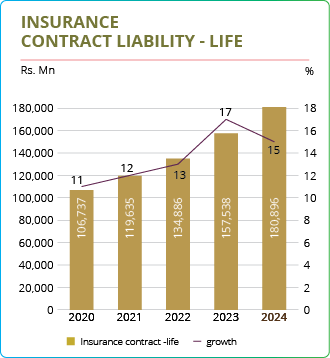
Total liabilities of the company increased by 12% year-on-year to reach the Rs. 190,692 Mn compared to Rs. 170,373 Mn in 2023. This increase was mainly due to the increase in Insurance Contract Liabilities - Life to Rs. 180,896 Mn from Rs. 157,538 Mn in 2023. Insurance Contract Liabilities - Life account for 95% of the total liability balance as at 31st December 2024.
Insurance Contract Liabilities - Life (or simply the Life Fund) is maintained by Ceylinco Life for its long-term insurance business, in compliance with the Regulation of Insurance Industry Act, No. 43 of 2000, as amended. The size of the Life Fund serves as a key indicator of a life insurer’s financial strength and stability. A larger Life Fund reflects greater financial resilience, stability, and the insurer’s ability to meet long-term policyholder obligations.
Please refer to pages 144-145 of the Operational Investment Committee Report for more details on the Long-term Insurance Fund
The actuarial valuation of the Life Fund as at 31st December 2024 was carried out by the Independent Consulting Actuary, Willis Towers Watson, whose report is given on page 272.
OTHER INSURANCE FUNDS
The Company has discontinued the business lines relating to the other insurance funds listed in the table below. These funds are maintained only for the benefit of existing policyholders.
| Description | 2024 Rs. Mn | 2023 Rs Mn | Change |
|---|---|---|---|
| Insurance Contract Liabilities - Unit Linked | 200,674 | 228,774 | -12% |
| Family Takaful Contract Liability | 19,441 | 17,496 | 11% |
| Individual Investment Fund - ISF | 427,762 | 414,963 | 3% |
| Total | 647,876 | 661,232 | -2% |
OPERATIONAL INVESTMENT COMMITTEE REPORT
Quality of Investments
Asset Allocation of Long-Term Insurance Fund
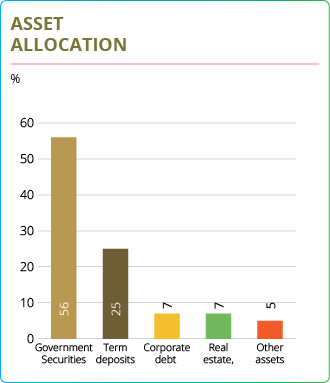
The investment strategy for the Fund has remained consistent with previous years, maintaining a dynamic asset allocation that reflects our prudent and conservative approach to enhancing returns while mitigating risks. The asset allocation as of end year was as follows,
- 56% of the Fund’s assets are invested in Government Securities, emphasizing a conservative, zero-risk investment approach.
- 25% is invested in term deposits, providing further stability and security, while enhancing returns.
- 7% is directed towards corporate debt issued by large licensed commercial banks, which are conservative yet deliver attractive returns.
- 7% is invested in real estate, providing long-term capital appreciation and defense against inflation
- 5% is invested in other assets, mostly loans to policyholders (1.64%), repurchase agreements (3.54%) and as well as a minor exposure to equity (0.16%).
DIVIDENDS AND DIVIDEND POLICY
Despite economic uncertainties, Ceylinco Life remained committed to a stable dividend policy. In 2024, the Company paid Rs. 750 Mn in dividends, compared to Rs. 912.5 Mn in 2023, achieving a dividend payout ratio of 12.52%. While ensuring a sustainable dividend distribution, the Company continues to allocate adequate funds for future business expansion. The Board of Directors has proposed a final dividend of Rs 17.70 per share for the financial year 2024.
TOTAL EQUITY
Shareholders’ equity increased and indicated a 12% growth from the previous year (2023: 10%). The stated capital of the Company remained unchanged at Rs. 500 Mn. The retained earnings increased to Rs. 48,742 Mn at the end of 2024 from Rs. 42,420 Mn in 2023. This was following the distribution of Rs. 750 Mn as a dividend (2023: 912.5 Mn). The revaluation reserve increased to Rs. 723.7 Mn in 2024 due to the gain recognised on revaluation of land and buildings.
The Restricted Regulatory Reserve, which was recognised in 2017 in compliance with Direction 16 issued by the Insurance Regulatory Commission of Sri Lanka, stood unchanged at Rs. 3,456.2 Mn as at the end of 2023. This represents the one-off surplus transfer made to the Shareholders’ Fund from other than participating business in 2017. Shareholders’ equity also includes a Special Reserve of Rs. 7,311.7 Mn, which represents the value of net assets transferred to Ceylinco Life Insurance Limited from Ceylinco Insurance PLC on 1st June 2015 as an effect of the regulatory segregation of the life insurance business from Ceylinco Insurance PLC.
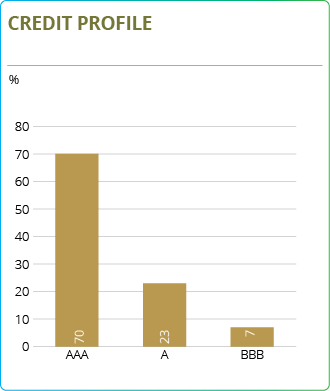
Quality of Investments
Credit Risk Profile of Long-Term Insurance Ltd
Credit Risk Profile of Long-Term Insurance Ltd
In terms of credit quality, 70% of total investments in the Fund are invested in AAA rated securities, i.e. highest credit quality. Another 23% of the investments are rated A, while the balance 7% is rated BBB. Further emphasizing our commitment to deliver investment returns that are secure, steady and stable, all investments are made with top-notch issuers and counterparties who are strictly screened by the Operational Investment Committee for their creditworthiness, capital adequacy, regulatory oversight, management acumen and track record.
Key Points –
- 56% of assets in Government Securities, 25% in term deposits, and 7% in corporate debt issued by large licensed Commercial Banks.
- 70% of assets are invested in AAA rated securities, emphasizing safety and high-credit quality.
- All investments are rigorously screened by the Operational Investment Committee for creditworthiness, regulatory compliance, and management acumen and track record.
Refer to page 136 of this report for information on Investment and Other Income
OPERATIONS INVESTMENT COMMITTEE REPORT
Investment Outlook For 2025
Looking ahead to 2025, Sri Lanka is expected to experience a strong economic recovery, with key indicators pointing towards a normalization of economic activities across all the sectors. Following a challenging period, the nation is likely to see a period of deflation in the first two quarters of the year, which is anticipated to drive a further yet gradual decline in interest rates reflecting the accommodative monetary policy stance. This lower interest rate environment will play a crucial role in stimulating both consumer and business activities.
In addition, Sri Lanka’s foreign reserves are projected to show a strong recovery, further strengthening the financial position and hopefully, an upgrade in the sovereign rating. Coupled with a focused effort on reducing the fiscal deficit, these positive developments are expected to create a stable foundation that will encourage growth and investment across various sectors.
In this context, the Committee acknowledges the potential viability of alternative investments, particularly non-fixed income instruments, given the economic recovery and expansion.
The Committee recognizes that investment strategies must evolve to address emerging challenges and the dynamic nature of market conditions. As such, the Committee remains committed to closely monitoring developments in the economy, financial markets, and monetary and fiscal policies. This proactive approach ensures that investment strategies are continually optimized to align with evolving circumstances, enabling us to navigate and adapt effectively in 2025 and beyond.
Key Points –
- Economic recovery is expected in 2025 with sector normalization.
- Deflation anticipated in the first half, leading to lower interest rates.
- Recovery of foreign reserves to strengthen financial position and sovereign rating.
- Committee acknowledges the potential of alternative investments, particularly non-fixed income instruments, due to economic recovery and expansion.
- Committee remains committed to be vigilant and proactive to optimize investment strategies
CASH FLOW ANALYSIS
| 2024 Rs. Mn | 2023 Rs Mn | Change | |
|---|---|---|---|
| Cash flows from operating activities | 16,235 | 18,522 | -12.4% |
| Cash flows from investing activities | -11,597 | -21,580 | -46% |
| Cash flows from financing activities | -4,804 | 3,141 | -253% |
| (Decrease)/Increase in Cash and Cash Equivalents | -166 | 84 | -298% |
As at the close of the year the Company’s cash and cash equivalents comprise of cash in hand and at bank net of bank overdraft. The net cash position declined by Rs. 166 Mn mainly due to the drop in operating income caused by the reduced investment income and increase in customer benefit payments. The bank overdraft facility as at 31st December 2024 amounted to Rs. 1,351 Mn, compared to the Rs. 913 Mn as at 31st December 2023.
OPERATING CASH FLOWS
Cash inflows from operating activities dropped by 12% YoY to reach Rs. 16,235 Mn for during 2024 compared to Rs 18,522 Mn recorded in the previous year, primarily due to the decrease in interest and dividend income received. The drop was mainly attributable to a series of monetary policy adjustments by the Central Bank of Sri Lanka (CBSL). The customer benefits paid increased by 7% YoY to reach Rs. 25 Bn and the Company incurred increased operating expenses in the current year, resulting in a 27% YoY increase in operating expenses paid, to reach Rs. 5.3 Bn in 2024.
INVESTING CASH FLOWS
Cash outflows from investment activities decreased by 46.3% YoY to reach Rs. 11,597 Mn from Rs. 21,580 Mn recorded in 2023 due to a range of factors. During the year, the acquisition of financial instruments decreased by 7% YoY. While the proceeds from the sale of PPE items increased to Rs. 31 Mn from Rs. 28 Mn in the last year. The Company spent more on acquiring PPE and intangible assets during the year with the aim of expansion and growth and achieving operational efficiencies. The proceeds from the financial investments reduced by 5% YoY.
FINANCING CASH FLOWS
Cash outflows from financing activities amounted to Rs. 4,804 Mn, compared to the cash inflows of Rs. 3,141 Mn in 2023. The reason for the net outflow in 2024 was the settlement of the short-term borrowing carried forward from 2023. The dividend paid amounted to Rs. 750 Mn in 2024, compared to the Rs. 913 Mn paid in 2023.
The management of cashflow is vital to operations, as it supports the maintenance of an adequate liquidity level to carry out business operations smoothly amidst the uncertain economic challenges. Some of the key initiatives implemented with the aim of closely monitoring cash flows are listed below:
Management of Cashflows at Ceylinco Life
Key Cash Inflows
Premiums
Regular payments from policyholders.
Investment Income
Returns from investments in Government Securities, corproate debentures, equities, investment properties etc.
Reinsurance Recoveries
Share of claims recovered from reinsurers.
Challenges
Low Interest Rates
Reducing investment income.
High Claims
Unexpected events (e.g., pandemics).
Regulatory Changes
New capital requirements.
Policy Lapses & Surrenders
Increased cash outflows.
Cash Flow Strategies
Asset-Liability Management (ALM)
Matching investments with expected liabilities.
Liquidity Management
Keeping cash reserves for short-term needs.
Investment Strategy
Working closely with the finance and investment teams to ensure funds are directed into profitable investments that generate higher returns for the company.
Cultivating and maintaining strong relationships with financial institutions to secure credit lines.
Reinsurance
Reducing risk through reinsurance contracts.
Expense Control
Reducing operational costs by adopting eco-friendly practices and using new technologies across the organization.
Managing spending to match expected cash flow, aiming to keep costs within or below the planned budget.
Paying suppliers on time to maintain good relationships and secure special discounts.
Debtor Management
Consistently following up with debtors to ensure the timely settlement of outstanding balances.
Key Cash Outflows
Claims & Benefit Payments
Payouts for maturities, death claims, surrenders and other claims
Operating Expenses
Adminstrative expenses, salaries and sales commissions
Reinsurance Premiums
Payments to reinsurers for risk-sharing.
Financial investments
Buying financial assets for returns.
Dividends
Dividend payment to the shareholder
Strong Internal Controls
Ceylinco Life maintains strong financial controls through internal audits, branch audits, and detailed reporting. They regularly update processes to improve efficiency and compliance, with automation helping to reduce errors and increase accuracy.
SLFRS 17 SUMMARY DISCLOSURE
1. Implementation of SLFRS 17
Sri Lanka Reporting Standard (SLFRS) 17 – Insurance Contracts will be effective from 01 January 2026, replacing SLFRS 4. The new standard introduces a consistent framework for measuring and recognising insurance contract liabilities, ensuring greater transparency and comparability across the industry.
Ceylinco Life has launched an implementation project to adopt SLFRS 17, aligning its financial reporting with global best practices. The standard affects revenue recognition, profit emergence, and liability measurement, enhancing the clarity of financial results for investors, regulators, and policyholders.
2. Measurement Approach Applied
Ceylinco Life will apply the General Measurement Model (GMM) for its long-term insurance contracts with the adoption of SLFRS 17 from 01st January 2026. The model consists of the following components:
Fulfillment Cash Flows (FCF):
Present value of expected future cash inflows and outflows, including claims, expenses, and policyholder benefits, adjusted for risk and discounting.
Contractual Service Margin (CSM):
Represents unearned profit, which is systematically recognised over the contract term as services are provided.
Risk AdJustment:
Reflects compensation for non-financial risk, ensuring a fair representation of insurance obligations.
3. Financial Impact of SLFRS 17 Adoption
The adoption of SLFRS 17 will lead to significant changes in financial statement presentation and key performance indicators as outlined below:
Insurance Revenue:
Recognised over time, reflecting services provided, rather than being based on premiums received.
Profitability Measurement
Profits are recognised gradually through the release of the CSM rather than upfront premium income recognition.
Liability Valuation:
More granular measurement of insurance contract liabilities enhances the accuracy of financial reporting.
4. Transition Adjustments & Comparative Information
In accordance with SLFRS 17 transition requirements, Ceylinco Life will apply a retrospective approach wherever possible.
The impact of the transition will be detailed in the financial statements, including reconciliations of equity, insurance liabilities, and retained earnings.
Restatement of prior-year financial statements to align with SLFRS 17 principles.
Adjustments to opening balances to reflect changes in liability measurement and profit recognition.
Enhanced disclosures to explain the financial impact of the transition.
5. Key Disclosures in Financial Statements
To ensure transparency, Ceylinco Life will provide the following SLFRS 17 disclosures in its financial statements from 01st January 2026.
Reconciliation of Insurance Contract Liabilities –
Movements in policyholder liabilities under SLFRS 17.
Contractual Service Margin (CSM) Movements –
Profit emergence over time.
Risk Adjustment for Non-Financial Risk –
Methodology and assumptions used.
Discount Rates & Assumptions –
Sensitivity analysis of key actuarial and financial assumptions.
Presentation of Insurance Revenue & Expenses –
New income statement format reflecting service-based revenue recognition.
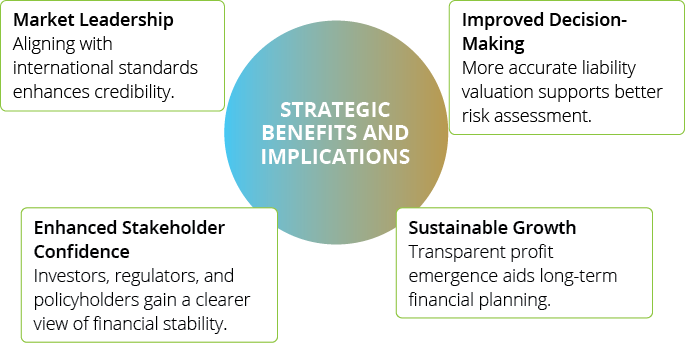
6. Strategic Benefits & Business Implications
The adoption of SLFRS 17 will strengthen Ceylinco Life’s financial reporting framework as follows:
|
Phase 01: (Already completed) |
Discussing the directly attributable expenses in relation to the direct insurance contracts consisting of: insurance acquisition cash flows; and non-acquisition, directly attributable expenses; |
| Version one of the discussion papers circulated by KPMG Sri Lanka were issued in November 2023, and further improvements were made thereafter. | |
|
Phase 02: (June 2024) |
Development of position papers prepared by Ceylinco Life and review by Willis Towers Watson (WTW) |
|
Phase 03: (August 2024) |
System development by Ceylinco Life, reflecting agreed methodology |
|
Phase 04: (September 2024) |
System testing by Willis Towers Watson (WTW) |
|
Phase 05: (October 2024) |
Dry Run |
|
Phase 05: (December 2024) |
Development of the opening balance sheet and financial statements |
|
Phase 06: (2025) |
Parallel run of the systems until the adoption of SLFRS 17 on or after January 1, 2026 |
7. Progress of Implementation
WHEN : SLFRS 17 is effective for annual periods beginning on or after 1 January 2026
TRAINING:Top management, department heads, actuaries, and the finance team were given training by KPMG Sri Lanka on the new standard.
PARTNERS:Transition work has commenced with KPMG Sri Lanka and Willis Towers Watson (WTW).
IT SYSTEMS:The Company has already invested in the leading enterprise-wide actuarial modeling system Prophet to assist in the implementation process.
SLFRS 9 SUMMARY DISCLOSURE
1. Adoption of SLFRS 9 – Financial Instruments
Ceylinco Life will adopt SLFRS 9 – Financial Instruments, from 1 January 2026, alongside with SLFRS 17 – Insurance Contracts. The transition from LKAS 39 to SLFRS 9 introduces a principle-based approach to financial asset classification, measurement, and impairment, ensuring stronger risk management and alignment with SLFRS 17.
2. Key Changes Under SLFRS 9
(i) Classification and Measurement of Financial Assets
SLFRS 9 categorises financial assets based on business model objectives and cash flow characteristics to better reflect their economic purpose. Ceylinco Life will classify its assets as follows:
This classification reduces accounting mismatches, ensuring that asset measurement aligns with liability valuation under SLFRS 17.
| Amortized Cost (AC): | Applied to debt instruments held primarily for contractual cash flow collection. These assets contribute to long-term financial stability. |
| Fair Value Through Other Comprehensive Income (FVOCI): | Used for debt securities that serve both investment and liquidity management purposes. |
| Fair Value Through Profit or Loss (FVTPL): | Applied to equity instruments and market-driven financial assets, aligning with dynamic investment strategies. |
(ii) Expected Credit Loss (ECL) Model – A Forward-Looking Approach
SLFRS 9 replaces the existing incurred loss model with a three-stage expected credit loss (ECL) model, which promotes early recognition of credit risk:
This model enhances financial risk monitoring, ensuring timely provisioning and improved capital adequacy planning.
3. Interaction Between SLFRS 9 and SLFRS 17
The simultaneous adoption of SLFRS 9 and SLFRS 17 ensures a more holistic financial reporting framework. This integrated approach enhances transparency and comparability in financial reporting.
Improved Asset-Liability Matching:
SLFRS 9's classification of investments will be aligned with SLFRS 17's liability measurement, reducing volatility in financial results.
Consistent Profit Recognition:
Investment gains and losses will be separated from insurance contract profitability, improving financial statement clarity.
Harmonised Risk Management:
The ECL model will complement SLFRS 17's risk adjustment, strengthening financial risk assessment.
4. Impact on Investment Portfolios
The adoption of SLFRS 9 will lead to a reassessment of investment strategies, as follows:
-
Debt Securities: The company is in the process of evaluating the debt securities for the reclassification.
-
Equity Investments: All equity instruments will be measured at fair value, either through profit or loss (FVTPL) or other comprehensive income (FVOCI).
-
Impairment Provisions: The transition to expected credit loss (ECL) provisioning will increase allowances, particularly for long-duration fixed-income assets.
These changes will provide a clearer risk profile for Ceylinco Life’s investment portfolio, ensuring sustainable financial stability.
5. Impact on Capital Adequacy and Regulatory Compliance
IMPACT OF SLFRS 9 ON CAPITAL ADEQUACY
- Higher Credit Loss Provisions: The ECL model will result in earlier recognition of potential losses, impacting regulatory capital ratios in the short term.
- Stronger Risk-Based Capital Planning: More precise impairment recognition will strengthen capital adequacy assessments.
- Alignment with Regulatory Requirements: The company will ensure compliance with local and international financial reporting standards.
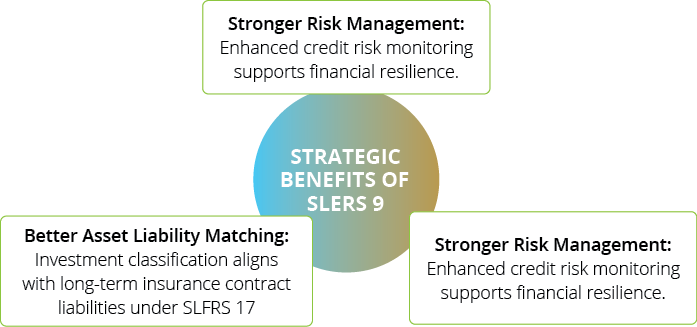
6. Strategic Benefits of SLFRS 9 Implementation
By adopting SLFRS 9, Ceylinco Life will reinforce its commitment to sound financial governance, ensuring a robust investment strategy that supports long-term growth.
The Role of Technology in Enabling Financial Performance
Automation & Cloud Adoption
Automating routine tasks (e.g., claims processing, premium billing, Transforming to Workflow Management System) implementing policy validations with banks and using cloud-based financial systems (SAP) improve scalability, security, and cost efficiency. During the year, the Company partnered with an accredited service provider/ consultant, and conducted a phased implementation of the SAP upgrade to minimise business disruption.
Data Analytics
Advanced analytics enable the creation of finance dashboards and facilitate the analysis of monthly financial statements for accurate, data-based decision-making.
ESG Integration
The budget allocation for 2025 is linked to ESG criteria to identify actual performance in comparison to budgeted performance.
Digital Payments & Customer Engagement
Online platforms, mobile apps, and AI chatbots improve policyholder experience and streamline transactions. The integration of Robotic Process Automation (RPA) processes for Group Premiums and payments empowers employees, and enables increased levels of productivity and efficiency.
Regulatory Compliance & Risk Management
Automated reporting ensures adherence to financial regulations, tax management, and audit transparency.